Spreadsheets
Organize data, run analysis, and generate insights, all powered by AI within your session.
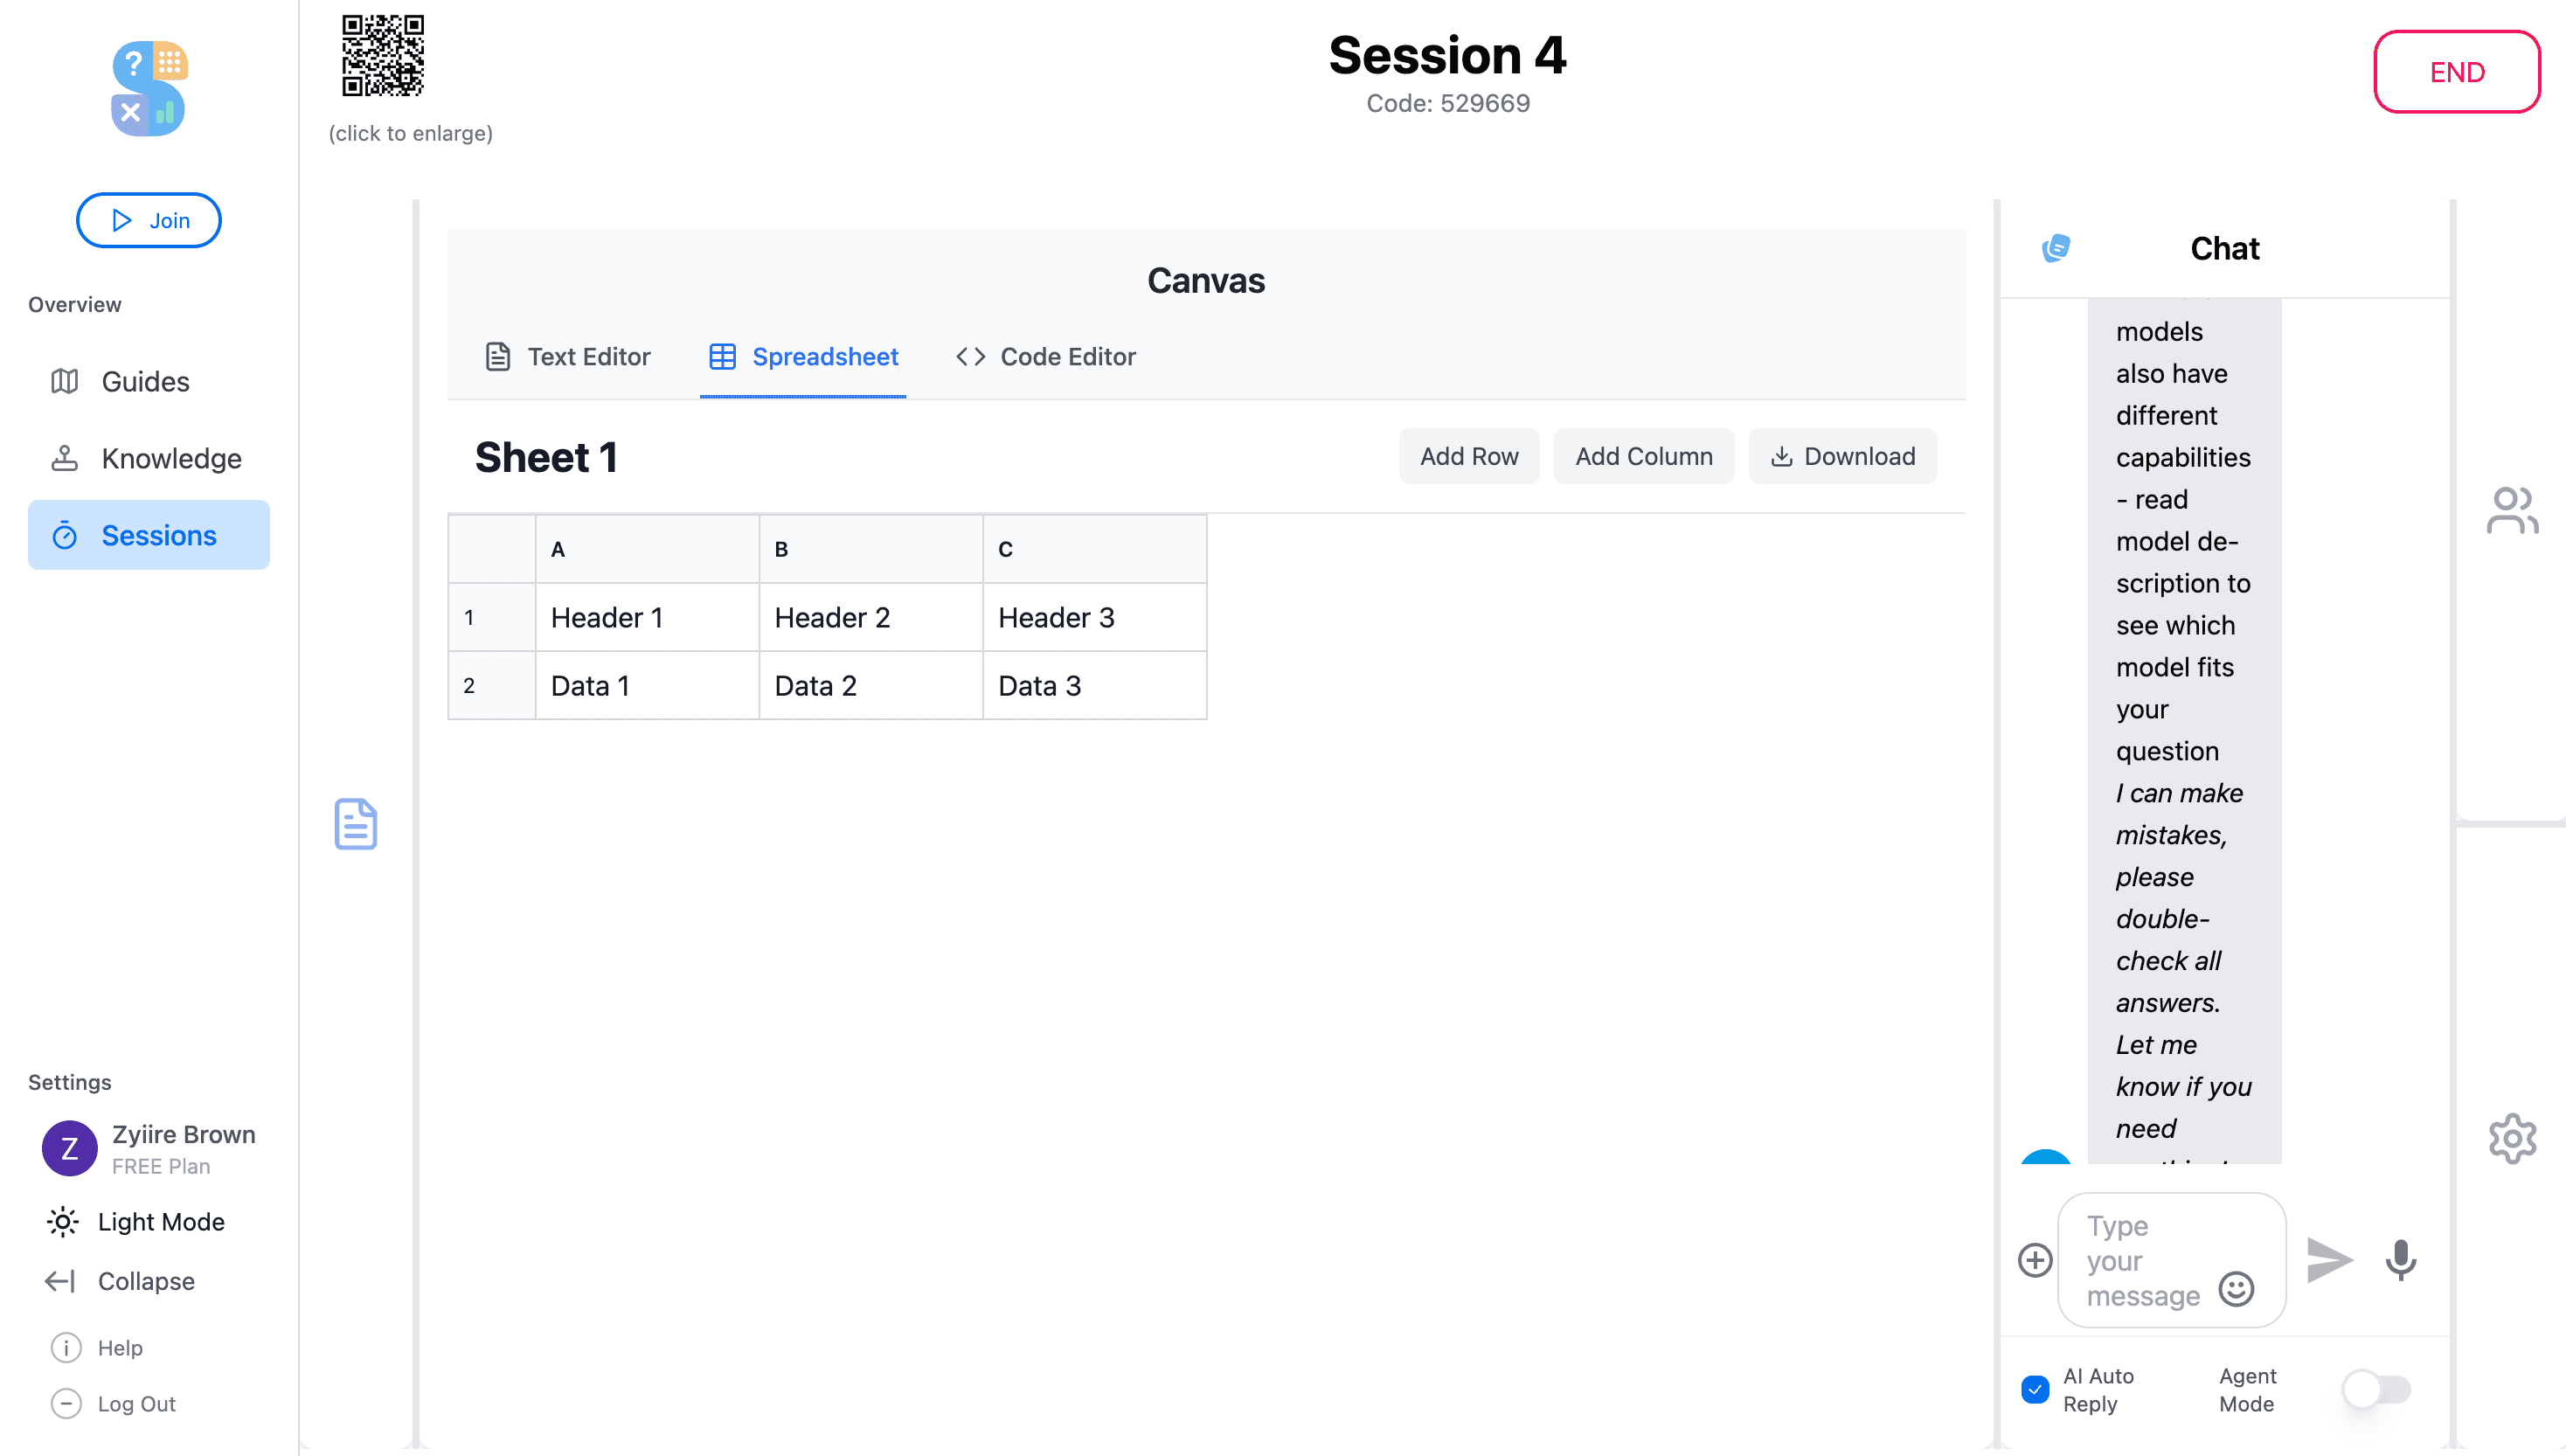
Spreadsheets in Thytus go beyond rows and columns. Create, edit, and analyze data directly in the session with full formula support. Ask an AI agent to clean messy datasets, generate pivot summaries, or surface trends, and the results appear right in the sheet.
Key Highlights
Live Data Editing
Create and manipulate spreadsheets directly in the session. Organize data, apply formulas, and sort columns in real time.
AI-Powered Analysis
Ask an agent to analyze trends, generate pivot summaries, or clean messy datasets. Results appear right in the sheet.
Import & Export
Bring in existing CSV or Excel files and export finished spreadsheets to share with stakeholders outside the workspace.
What you can do
Formula Support
Use standard spreadsheet formulas to calculate, aggregate, and transform your data.
AI Data Cleaning
Ask agents to identify and fix inconsistencies, duplicates, and formatting issues across your dataset.
Chart Generation
Turn your data into visual charts and graphs with a single prompt to your AI assistant.
CSV & Excel Compatibility
Import and export in CSV and Excel formats for seamless integration with external tools.
Try the Spreadsheets today
Get started for free and experience spreadsheets powered by collaborative AI.
Get Started for Free